Showing posts with label Watershed Stories. Show all posts

Tuesday, July 21, 2026

Tracks of Rain

 Last week, on the afternoon of Monday July 13th, 2026, I was hiking up the French Ranch Fire Road and saw rainprints in the road. It was 90 degrees, humidity was 30-40%, and it was cloudy and muggy. The next day San Geronimo's temperature would exceed 100 degrees for the first time in July (since I began keeping records in 2012).

But despite the hot dry air, there was evidence that raindrops had reached the ground that day. The rain prints were little pinpoints in the dust--some even looked like they were still wet, although I think that may have been just shadowing.


Heavy equipment has been working on the ridge daily, incrementally moving east, turning the fire road into a smooth superhighway for runoff to accumulate in new wider carefully-graded swales that drain off the road. It was hard to see this done to Willis Evans Canyon a few years ago, but it grew back and the road edges were once again covered in leaves and needles. Vehicles usually don't drive here, but the road seems like it is being readied for heavy traffic and heavy rain. Perhaps the Super El Nino has motivated the work.

Before road maintenance


After road maintenance

Because of the daily earth moving work on the ridge, trucks had driven down the access road since the rain. There were no rainprints in the tire tracks.

This meant that the rain had fallen earlier, before the workers headed home in the afternoon. Humidity peaked around sunrise and again around noon... both plausible times for the rain to have fallen to the ground.

The following Monday--yesterday--rain fell in Inverness. Today, Tropical Storm Elida, 500 miles southwest of Monterey, could bring more tracks of rain.

Come to think of it, there was a water truck working up on the ridge. It could have come down to refill, and splashed drops of water onto the road as it returned up the steep grade. Maybe it wasn't rain at all.

Wednesday, June 24, 2026

Succession

Primary succession is the process of lichen, algae, fungi, and eventually plants establishing themselves on new ground without soil. This could be a lava flow, or an area uncovered by a retreating glacier. Secondary succession is the process of plants re-establishing in areas already covered by soil, for example after a fire.

Riverine succession sometimes is primary (on large deep barren sandbar deposits) or secondary (where sediment deposition is shallow or doesn't bury pre-existing vegetation.

Primary succession usually takes longer than secondary succession.

Sunday, May 25, 2025

Catching up on the February Storms

 It doesn't feel right to let this rainy season fade away without writing about the February storms--especially when they included a rare thunderstorm, and some were bigger than the December storm, which I did write about. So here it is May, the fourth average or wetter-than-average year in a row, and while the soil is already cracking due to the dry spring (although March was average with 6.3" of rain), things look good: the grasses are tall and there is still much green, and the now-disappearing flowers have been wonderful. And a pleasant surprise--the invasive deeply evil (in California, I'm sure it is nice where it is native) star thistle seems to be crowded out by other plants in many areas.

2025 water year total to-date is 47.87" as of the end of May.


Let's turn the clock back to February.

Friday, April 25, 2025

West of Huntoon Spring

"Of what avail are forty freedoms without a blank spot on the map?" --Aldo Leopold

There is a USGS topographic map in the 7.5-minute series called “West of Huntoon Spring.” Maps in this series are typically named for prominent features that occur on the map. “West of Huntoon Spring” has no notable features that are worthy of a map name, so it is named for a feature on the map that is to the east: Huntoon Spring. This empty spot is simply “West of Huntoon Spring.”

Monday, December 30, 2024

December 2024 Storm

On December 13, 2024, it started raining in the evening, and mostly stopped by 9am on Saturday December 14th.

The Nov 22nd and Dec 14th peak flows on San Geronimo Creek were the same: 1,105 cfs. Daily average flows were 423 cfs & 356 cfs, respectively. In November it took 8.75 hrs of 2.34" of rain (1/4" per hour) to get to peak from 113 cfs; In December it took 7.25 hrs of 2.32" of rain (1/3" per hour). These calculations use rounded times to the nearest hour for rain and quarter hour for flow & add an hour of lag time between rain and flow.

And then things got crazy.

Saturday, December 28, 2024

They turned it into Muir Woods

 "They turned it into Muir Woods," I heard someone say as I was leaving Roy's Redwoods yesterday. Roy's Redwoods is San Geronimo Valley's busiest and most famous local redwood grove. There grows the tallest tree in Marin County. 

I had heard this criticism of the $3.5 million Roy's Redwoods rehabilitation project before. The Marin County Open Space District site was closed all summer and completely redone. It is nice to be able to go back this fall and see what it looks like.

The goal of the project was to "

  • Restore the hydrologic function of the alluvial valley;
  • Improve redwood forest and wetland habitats;
  • Guide visitors through an immersive and accessible experience of the redwoods."

When something like this happens, it is like gentrification of the woods. The "new" Roy's Redwoods looks nice--nice trails, well-organized, nice stone work (although the large boulders are a bit out of place and seem to belong in the Sierra Nevada), nice new boardwalks and bridges. It is welcoming in a familiar National Park sort of way, and makes walking the trails pleasant and efficient. I really like the nested loops of the named trails--once you figure out that pattern it is fairly easy to remember where the trails go. The Wilderness Way exploration and adventure zone is a nice (and surprisingly hazardous, and a totally fun mud pit when rainy) touch.


Nice new bridges

Wilderness Way adventure area

Sunday, December 1, 2024

November 2024 Atmospheric River

The November 20-22, 2024 Atmospheric River dropped 11.65" in San Geronimo Valley compared to much higher amounts to the north. It was not as wet as the October 2021 storm (that dropped 12.67" in 36 hours causing San Geronimo Creek to peak over twice as high). But the 2024 storm lasted longer--it rained for three days straight (except for a break during the second night). It was so nice to see the sun again on the bright yellow fall leaves on Saturday! San Geronimo Creek peaked at 1,105 cfs at 2:15 pm on Friday November 22nd (at day 3 hour 14 on the graph below). The creek started at its late summer-fall baseflow of less than 1 cfs at the Lagunitas gauge, and as of December 1st is still flowing at 7 cfs. The peak flow was similar in magnitude to last winter season's highest flow in January. We already have about a third of our annual average rainfall as of the end of November, and our 3rd-highest to-date total since water year 2012. Along with over an inch of rain in early November, this has been a wonderful start to our rainy season.

Barnabe and Woodacre rain are reported about 10 minutes before and after the hour, respectively, but shown on the hour here (the hourly differences are mostly due to that). The x-axis is day.hour. 

Monday, November 11, 2024

Reconciliation

On October 26, 2024, the Alliance for Felix Cove hosted a reconciliation conversation between a Tamal-Ko (Tomales Bay Coast Miwok) family and a Point Reyes settler family. The settler family's ancestor, C.W. Howard--who owned most of the land on the west side of Tomales Bay--in 1887 hired Captain Henrik Claussen to evict all the Indians living on the west side of Tomales Bay. Their houses were destroyed and the people were forced to leave. One house remains standing at Felix Cove (Laird's Landing, used by the Lairds to ship dairy products to San Francisco 1860-1866). The last of the Felix family was evicted from their ancestral home by ranchers in 1952, and then later the ranches became part of the Point Reyes National Seashore--owned by all of us and managed for us by the National Park Service.

Felix Cove in 2020

Tomales Bay
Looking up Tomales Bay from above Felix Cove

The road to nearby Marshall Beach

The thought-provoking conversation included how family members learned of their ancestors' history and how they feel about it, complete with long-overdue apologies. It also included discussion of reparations--specifically, returning Felix Cove to the now landless (aside from a recently-acquired parcel in Nicasio) and federally-unrecognized tribe. You can support their efforts here.

Etcha Tamal, rematriated Coast Miwok Tribal Council
land in Nicasio (photo taken in 2015 after pile burns, and
prior to the 2023 purchase)

The conversation was relevant to all of us, since we all are either indigenous to the land where we live or from somewhere else, and many of us from somewhere else have ancestors who came here and displaced the indigenous people. It felt personal to me, because I too have ancestors that pioneered a dairy industry in the 1850s on stolen indigenous land. And it made me realize that I too would like to apologize for those actions. This is that apology.

"At some point, you have to decide, are you going to live in a world of abundance, open-heartedness, and open-mindedness, or are you going to live in a world of exclusion, isolationism, and scarcity?"
--Theresa Harlan, founder of the Alliance for Felix Cove, describing why she laughed at herself when contacted by a descendant of the Point Reyes colonizers

Saturday, October 12, 2024

October 2024 Heat Wave

 The October 2024 heat wave was the warmest early-October weather in the Bay Area since 1980. Above average temperatures began for San Geronimo Valley just before the autumnal equinox, which was the beginning of 18 days over 80 degrees F, 10 days over 90 F, and 3 days over 100 F. Two of the days in the 90s occurred in September, then there was one cool day--September 25th, where the high only reached 69 degrees. After that there were 13 days in a row exceeding 80 F and 8 days in a row exceeding 90 F. In October, it had never been over 95 F before, but 3 days over 100 F and 3 days over 95 F set new October monthly records (since I started recordkeeping in 2012). October has now become a month when it can not just get hot, but really hot.

As with many heat waves, the remarkable thing was

Tuesday, January 17, 2023

Storm Totals, Storm Damage, Power Outages, Falling Trees, and Moving Logs

January 2023 will go down in the record books as one of the stormiest, snowiest, and rainiest months for many parts of California. As of January 16th, San Geronimo Valley had received 19 inches of rain--making it our second-wettest January in the last decade (after 2017). In addition, the wind, landslide, and flood damage has been widespread. And the month is only half over. Much of that was packed into the first 11 days.

The story starts in December, after a dry October-November start to the 2023 water year (following 3 dry years). Here in San Geronimo Valley, I measured 16.59 inches of rain in December, at 240% of average, the wettest December in 8 years and second-wettest in the last decade.

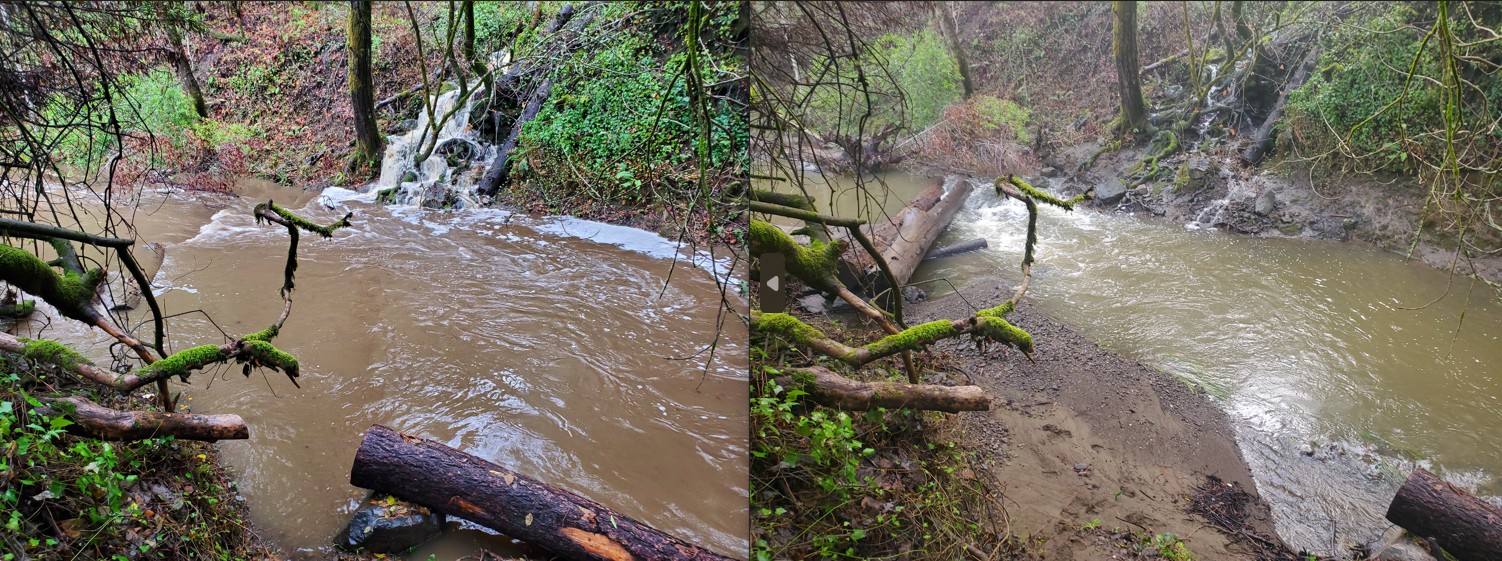
Logs began moving in San Geronimo Creek in early December, when a series of storms brought rare lightning and thunder, and enough rain to get San Geronimo Creek up to 200 cfs. This was not a large flow, but trees fell in the creek and rafted down to an engineered logjam that was placed in the creek in 2020. An October 2021 storm that peaked at 2,500 cfs had already moved around the logs connected to boulders in this logjam--logs that were designed to stay in place. Surprisingly, a log that didn't move in 2021 was scooted several feet downstream by the 660 cfs flow on December 27th, 2022. It stopped when the boulder it was anchored to bumped up against another log embedded in the creekbed.

Note the moving log bolted to a boulder at the lower right corner of the
photos on December 10th (left) and December 28th (right).

Two storms at the end of December were impressive. The one on the 27th dropped half-an-inch of rain an hour for six hours. Once again there was rare lightning and thunder. Read about "snow level bending" as freezing levels fluctuated near Lake Tahoe. Twenty-two foot waves towered along the coast.

storm waves at North Beach, Dec. 26, 2022
On December 26th, 2022, seventeen-foot waves were oversteepened
and trailing banners of spray because of the east wind. They foreshadowed
the 22-foot waves that were forecasted on the 27th.

Saturday, November 27, 2021

Bob's Trees

About six years ago, I wrote a blog post called "Bob's Trees," after one day, my neighbor Bob told me about the trees near his house. He had lived in that house for a long time, and passed away on November 8th, 2015, after living close to 100 years.
Unfortunately, as I tried to upload a photo of a ginko leaf, the browser crashed and the entire blog post was lost.
Since then, I had always hoped that I'd remember any of the stories enough to write them down, but now six years later, I'm pretty sure I won't.
But the trees are so amazing, especially in autumn, and I want to tell their story. The story of the ginko, in front of the house that Bob said used to have a truck regularly parked on the front lawn/steps. The story of the Japanese maples. The story of the birch. But I don't remember.
What I do remember slightly are his stories of working at a bank, and of San Quentin (where his dad may have worked?). I remember they were often humorous, at times offensive or inappropriate, but interesting stories that only a 96-year old can get away with telling. Even those stories are now lost--surprising details I was sure I'd remember are now faded--something about the trunk of a car and San Quentin. Because I stopped to listen, and he took the time to share, I felt almost a responsibility to share the remarkable stories.

So I saved this draft blog post with a few notes, and every time I scroll down far enough to see it, I think I'll finally write something about Bob's Trees. Well, this is it.
A note I made here about a dumpster--I don't remember the story I wanted to tell when I wrote the abrupt note six years ago, but after Bob died, his house was so full of unwanted stuff that a dumpster sat out front for a while, and free books sat on shelves in front of his house until the winter rains finally ended the drought and soaked the books. There was probably something really interesting or funny about the dumpster, but then I had a child and four years of new daddy brain plus two years of pandemic brain. I've been unearthing pre-pandemic layers in piles of paper, and it is striking how unfiled papers mimic geologic strata--and how quickly two years can go by, and be buried by more current matters. Like unraked ginko leaves in autumn covering organic material from last year's leaves.

Wednesday, December 30, 2020

Islands in the Sky

 Fog--often surrounding ridges and peaks like water surrounding an island--is shown in the following photos, which were taken on eight different days during five different months in 2020. Enjoy.


Monday, May 18, 2020

I went to the beach

Has anyone else been reading headlines and news articles as if they were from The Onion during regular times? The video of the guy cleaning his groceries is classic and will be watched in disbelief by incredulous audiences many times in future years (but honestly, it is helpful, and right now we are following some of his guidance). The Point Reyes Light's "Sheriff's Calls" is full of people reporting other people doing very normal things, like going to the beach, surfing, etc. On social media too, from people's reactions, you'd think going to the beach was somehow dangerous--for people who only are familiar with crowded Southern California beaches on summer weekends, this attitude is excusable--but the world is full of lightly-traveled beaches with few virus-carrying humans where it is perfectly safe to be (and probably one of the safer places to be in the spectrum of risk).

So last weekend I went to the beach (yes, this used to be normal and acceptable behavior). And I wasn't going to let anything stop me--not the dirty dishes (partially dealt with), screaming kids (handled), lovely wife, cute cats, social media shamers, poorly-worded closure signs, or lingering symptoms. I'm so done with being sick. After seven months of sickness and disease (with two kids in two schools we get plenty of colds), and having had the latest cough for over five weeks, I was finally feeling well enough for a big day of exercise. I needed to get out.

By the way, my SARS-CoV-2 antibody test came back negative. So I had the flu shot last fall, plus I probably had the flu or something similar twice since January. But I digress.

The bike ride from San Geronimo to Limantour Beach is about 20 miles (40 miles round trip). After passing through the Samuel P. Taylor State Park campground on the Cross Marin Trail, I was catching up to three cyclists ahead of me. Not really wanting to deal with passing, I followed at a slower pace, then at Platform Bridge they disappeared and I merged onto Sir Francis Drake Blvd adjacent to another cyclist. I tried to get ahead but couldn't, then fell back, then passed, then was passed. This was my first time over Olema Hill on a bike, and it was hard to find my pace while at the same time trying to be adequately physically-distanced ahead of or behind the other rider, who was much older but frequently rides long distances. He disappeared ahead before I reached the top.

Sunday, March 1, 2020

Paired-watershed Study

A paired-watershed study is conducted by using two similar watersheds and evaluating them for differences. One watershed is a control and the other has a management change applied to it. You can then measure the differences in flow and water quality exiting the watersheds, and have a pretty good idea of how the management change influenced any flow or water quality changes. Or in this case, with no management applied, the differences reveal natural differences in the watershed.

February 2020 was the driest February since 1864 in San Francisco. No rain fell there, as well as here in San Geronimo Valley (except for one weather station (WDAC1) that picked up 0.01 inches of precipitation on February 24th). December precipitation was 200% of average, however January was only 37% of average. February was 0% of average.

San Geronimo Creek peaked at a respectable 210 cfs in December--the highest December flow in 3 years, but less than 1/10th the peak flow in 2016--a good situation for Coho salmon redds, which got plenty of water but wouldn't have been washed out by flows high enough to scour the streambed. Since there weren't that many redds this year, a higher survival rate would be nice. January's peak flow was 70 cfs. February's was 6 cfs--perhaps the lowest February flow since 1864.

Thursday, January 17, 2019

January 6th and 16th storms compared

The weekend of January 5-6, 2019 was a very wet one, and San Geronimo Creek reached 1,000 cfs for the first time since February 2017. 2018's peak flow was 753 cfs in March.

About a week and a half later, on January 16, 2019, there was another big storm--more well-advertised than the first, and windier, but not necessarily wetter. The storms were similar in many ways, but San Geronimo Creek peaked higher during the second storm, at 1,304 cfs.

Jan 6th storm, with day.hour on the x-axis.

Jan 16th storm, using the same day.hour as the Jan 6th storm, lining up
both peak flows between hours 17 and 18 on day 2. The Jan 6th peak was
at 5:30 pm and the Jan 16th peak was at 9:15 pm.
The graphs show the different patterns of rainfall and creek flow. The January 6th peak was broader, with a longer duration at high flows (over 400 cfs), however the January 16th peak had a longer duration at about 200 cfs. The antecedent conditions were wetter on the 16th--36 cfs 16 hours before the peak, vs. only 7 cfs 16 hours before the Jan 6th peak.

How do the total volumes compare? The typical pattern in San Geronimo Valley is for the Woodacre precipitation station (to the east) to be wetter than Mt. Barnabe (to the west), and that pattern held on the 6th. It was reversed on the 16th--Barnabe was wetter than Woodacre. Although the volume of runoff during the 16 hours prior to the peak was only 3% higher on the 16th, the magnitude of the peak flow on the 16th was 23% higher than on the 6th. The table below shows well how similar the storms were. Note the 6th was wetter in Woodacre, and the 16th was wetter on Mt. Barnabe.


Tuesday, December 11, 2018

Shadows of Rain

We have all heard of "rain shadows," where precipitation declines "precipitously" in the lee of a mountain range. California has many examples--you'll see the phenomenon eastward of any major mountain range.

The Mono Basin has a classic rain shadow--over forty inches of annual precipitation at Tioga Pass, on the crest of the Sierra, and about seven inches on the east side of Mono Lake. Those two locations are separated by an elevation difference of 3,500 vertical feet and a distance of 15 miles.

Isohyetal map of the Mono Basin from Vorster, 1985. Red line depicts the
precipitation gradient discussed in this blog.

Saturday, November 3, 2018

Cannibal Water, Part 3

So how do we wean water users off cheap, addictive Cannibal Water?

Cannibal Fork, brought back from the South Pacific by a friend, Mike Klapp.
For urban users, it is not a problem. Urban water use has been declining for decades. Continue investing in efficiency, water recycling, stormwater capture, and groundwater recharge. Don't invest in expensive, carbon-intensive, fish-killing, polluting desalination unless you are a small isolated coastal community with no other options. Brackish groundwater desalination is okay. Avoid growth, which makes every problem worse, and eats up any water savings you achieve. But if you do plan to grow forever, then you need to make sure your long-term water strategy continues to cut water use to the point where kids will grow up not knowing what a water fight is. Not just squirt guns, I mean a really good one, with hoses and buckets. And growing forever would also require suspending some physical laws of nature, so we might as well stop growth now, while some parts of California are still nice places to live.

Monday, June 4, 2018

Navigable in Fact

I love this Outside article (Drawing a line in the sand over river rights, by Chris Colin)--I love that someone did this. Raising awareness of when public rights are being usurped by private interests is always a good thing. And this one is close to my heart--for a while I made it a hobby to float any and all navigable waters (the smaller the better). And when you spend a lot of time outside off the beaten track, you run into private property obstacles and questions all the time.

Sometimes you have to combine skiing and
kayaking to get where you want to go. Stumps
in the distance are below the high water line of
Grant Lake Reservoir.
Easement Etiquette
As much as I like the article, I don't approve of how the author went about exercising his rights. It made for a good article, but there needs to be some etiquette when exercising the right to use prescriptive easements and navigability easements and sovereign lands:
     1. Be courteous - respect wildlife, other recreationists, the privacy of adjacent property owners, and avoid dwellings
     2. Leave no trace
     3. Be invisible, if possible - if they don't know you are there you won't get hassled
     4. Contact property owners and agencies when the public is being bullied, and bring wire cutters (e.g. look up the East Walker River from the Hwy 395 bridge--if you wanted to float it, you would need them).

Essentially, behave like you are in a campground. Respect the campers in the campsites you are next to (or you are taking a shortcut through if no one is home).

Special Cases
The problem is that the Russian River situation is rare. Where the public's rights are clear, and the property owners are clearly violating them, that is a good place to write an article to raise awareness. But those situations (in California) are the exception. Here grey areas are the rule. The following are categories of grey areas I've encountered.

Thursday, May 3, 2018

Avalanches, Ticks, and Delta Smelt Salvage

I joke that when I go for a run on the trails around my home in San Geronimo Valley, I'm doing tick surveys. Which is essentially true--one method of catching ticks for study is to drag fabric through grass, and the ticks latch on. That is what I do when my legs brush past grass and twigs.

I don't keep formal track of the ticks I find--or more accurately, the ticks that find me. Which is unfortunate, because there is a nice dataset there. But from my memory, what has struck me is the variability. Just when I think I see a pattern, and understand what is going on, and formulate a hypothesis, I observe ticks in places that confound that pattern. Or I hear about others' observations that don't match my mental model.

Take this year for example. I had not seen a tick until last week, yet word on the street (or fire road?) was it was a bad tick season. So I began putting together a hypothesis about the cold December, dry winter, and very wet March: that prior to March, ticks were scarce (at least, scarce in my surveys) in grassy areas where I was running because of the low growth and short grass. Since March the heavy rain impacted the ticks in these areas in some way, possibly washing them out of the grass and drowning them.

Tuesday, January 30, 2018

First Frostless January

Since we moved to San Geronimo in 2011, January has warmed tremendously. Frosty days at or below 32 F have disappeared completely:

  • 2012 - 31% of days were frosty, and 25% of days were in the 20s
  • 2013 - 53% of days were frosty, and 30% of days were in the 20s
  • 2014 - 58% of days were frosty, and 29% of days were in the 20s
  • 2015 - 13% of days were frosty, and 10% of days were in the 20s
  • 2016 - 7% of days were frosty, and both days were in the 20s
  • 2017 - 16% of days were frosty, and for the first time no days were in the 20s
  • 2018 - no frosty days
The green and blue minimum temperature lines show dramatic warming over the
last few years. Jan 2013-15 had less than 4% of average rainfall.
Luckily, this January follows a December when 63% of days were frosty. This ties 2013 for the most frosty days, well ahead of any other year.

I say "luckily" because just think of the implications of not having frost. It affects everything--fruit trees, insect activity... it also affects the length of the growing season, since February hasn't gotten below freezing since 2015 and March hasn't been below freezing since 2012.

And for only the second time in 7 years, January had no high temperatures in the 40s--the highs were at least 50 F all month. The lowest max is not shown on the graph.

Luckily, here it has rained enough to make it wetter than 2012 or 2014 at this point in the season. Unfortunately, those were our two driest years since 2011, at 70% and 51% of average, respectively.